Plastic Pollution and Recycling
Join the global bottle deposit program
Fuelled by the world’s most progressive people.
 Plastic waste on the Julugan Fish Terminal, the Philippines.
Every year, between 19 and 23 million tonnes of plastic waste enter rivers, lakes, and oceans worldwide, according to the UN Environment Programme. That is the equivalent of a garbage truck every single minute. The plastic in the ocean now numbers between 82 and 358 trillion particles floating on the surface alone, with concentrations accelerating since 2005 (ref: Stop Ocean Plastic).
Environmental Sustainability & The Sources of Ocean Plastic Pollution
The primary source of ocean plastic pollution is mismanaged waste on land, which eventually finds its way into the ocean through rivers, lakes, and other waterways. These waste materials include plastic bags, bottles, food packaging, and other single-use plastic items. Once in the ocean, plastic breaks down into smaller particles known as microplastic, which can be mistaken for food by marine animals that humans eat – posing a risk to our health.
Addressing ocean plastic pollution requires a collective effort from all sectors of society to reach a whole environmental sustainability. This includes governments, businesses, communities, and individuals working together to reduce plastic waste and manage it effectively. However, there is an ongoing debate about which countries are responsible for the majority of ocean plastic pollution. Some argue that developed countries are responsible for producing more plastic waste per capita, while others suggest that developing nations bear the brunt of the problem due to inadequate waste management infrastructure. To clear this up, let’s find out where most of the ocean plastic waste comes from.
World’s Top 10 Ocean plastic Contributors for an Excellent Environmental Sustainability
Based on a study by Science Advances in 2021, the Philippines is the leading country on the list of top 10 ocean plastic contributors – generating an estimated 356,371 MT of plastic waste in our ocean. This is followed by India (126,513 MT) Malaysia (73,098 MT), China (70,707 MT), Indonesia (56,333 MT), Myanmar (40,000 MT), Brazil (37,799 MT), Vietnam (28,221 MT), Bangladesh (24,640 MT), and Thailand (22,806 MT)2. The primary contributors to ocean plastic pollution are concentrated in developing Asian nations, with the exception of Brazil.
The research highlights that countries with smaller land areas, lengthier coastlines, increased rainfall, and inadequate waste management infrastructures are more prone to having their plastic waste end up in the ocean.
 Credit: Louis Lugas Wicaksono3 (Source: Visual Capitalist)
Environmental Sustainability | World’s top 10 plastic waste producers
Many people think that the top ocean plastic polluters are also the most plastic waste-producing countries, but that is not the case.
According to the World Population Review, the US ranks first in the top 10 countries that generate the most plastic waste – producing 34 billion kilograms annually. India comes at second place with 26.3 billion kilograms of plastic waste, followed by China (21.6 billion kilograms), Brazil (10.6 billion kilograms), Indonesia (9.1 billion kilograms), Russia (8.4 billion kilograms), Germany (6.6 billion kilograms), the UK (6.4 billion kilograms), Mexico (5.9 billion kilograms) and Japan (4.8 billion kilograms)4.
While India, China, Brazil and Indonesia entered both the top 10 plastic waste producers and ocean plastic contributors, the rest of the list are mainly high-income Global North countries. Although the population of these developed countries generate high amounts of plastic waste, they have better waste management infrastructure and plastic recycling facilities in their communities than middle to low-income nations. Thus, developing countries tend to produce a higher amount of mismanaged plastic waste that leaks into the ocean.
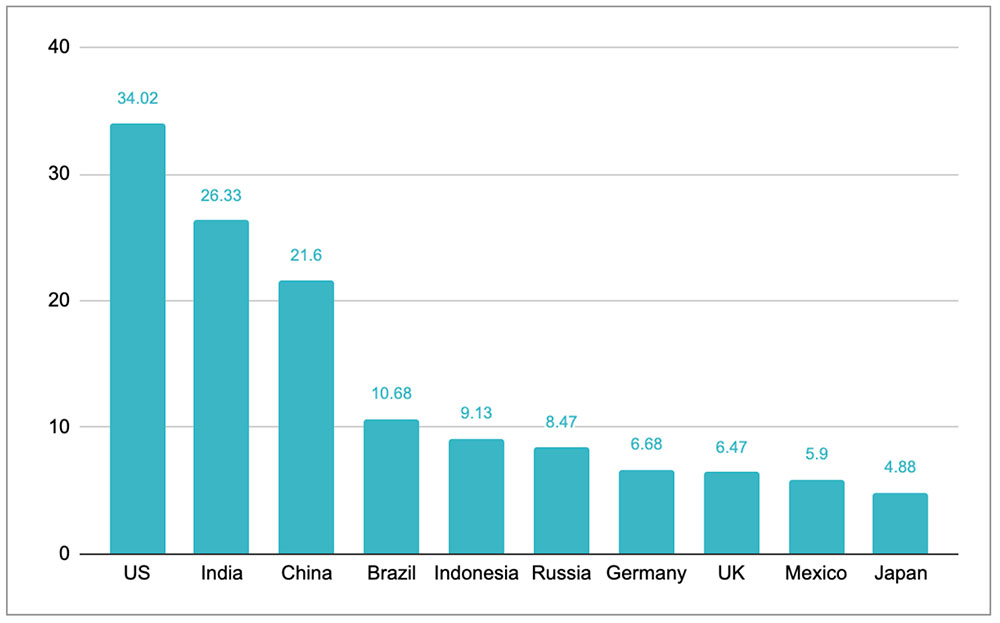 Top 10 countries producing plastic waste (total billion kilograms, 2016 (source: World Population Review)
Plastic Waste Exports
Another common misconception to promote environmental sustainability is that the plastic waste exports from the Global North countries to the Global South is a major source of ocean plastic pollution. Statistics from Our World in Data show that most countries export their waste within the same region5. For instance, European countries export mostly within the European region, and Asian countries export mostly within the Asian region.
The countries also handle most of their plastic waste domestically and export a relatively small amount abroad. For example, let’s take a look at the UK, one of the largest plastic waste exporters. In 2010, the country exported 838,000 out of 4.93 million tonnes of plastic waste. This number accounts for 17% of its total plastic waste. In comparison, the Netherlands exported 14% of its plastic waste, France exported 11%, while the US only exported about 5%.
While the plastic waste export may contribute to the mismanaged plastic waste leakage into the ocean, the study argues that it is relatively low at around 5%. This means that even if we were to completely stop plastic waste trade, it would only have a limited impact on reducing ocean plastic pollution and improving environmental sustainability.
What is needed to stop ocean plastic?
As a global citizen, we can contribute to stopping ocean plastic by:
- Reducing our consumption of single-use plastic and promoting environmental sustainability
- Ensuring that our plastic waste is appropriately disposed of and recycled
- being a conscious consumer and exhibiting demand for products made of recycled materials like Plastic Bank’s Social Plastic®.
But on a macro level, governments and institutions should focus on investing in better plastic waste management systems and educating vulnerable communities about the threats of plastic pollution. Developing countries, however, lack the resources to build proper waste infrastructure in their communities.
 Plastic Bank collection community members in Bali, Indonesia.
This is why Plastic Bank works with its global community of Ocean Stewards to establish ethical plastic collection branches within 50 kilometers of coastlines and waterways in vulnerable areas across Southeast Asia, Latin America and Africa. Our collection community members gather plastic waste directly from local beaches, riverbanks, neighbourhoods, and even households – so that we are able stop ocean-bound plastic directly at the source. Collected material is exchanged for secure income and life-improving benefits that include access to health, work and life insurance, social assistance, digital connectivity and banking services. Together, we are working hand-in-hand to stop ocean plastic and alleviate poverty in developing countries and promote environmental sustainability.
So, which country is the most responsible for ocean plastic? We all are responsible to stop ocean plastic and together, we can stop it faster and better.
We invite you – as individuals or businesses – to take action to stop ocean plastic and alleviate poverty by joining our Social Recycling movement. Learn more at: plasticbank.com.