

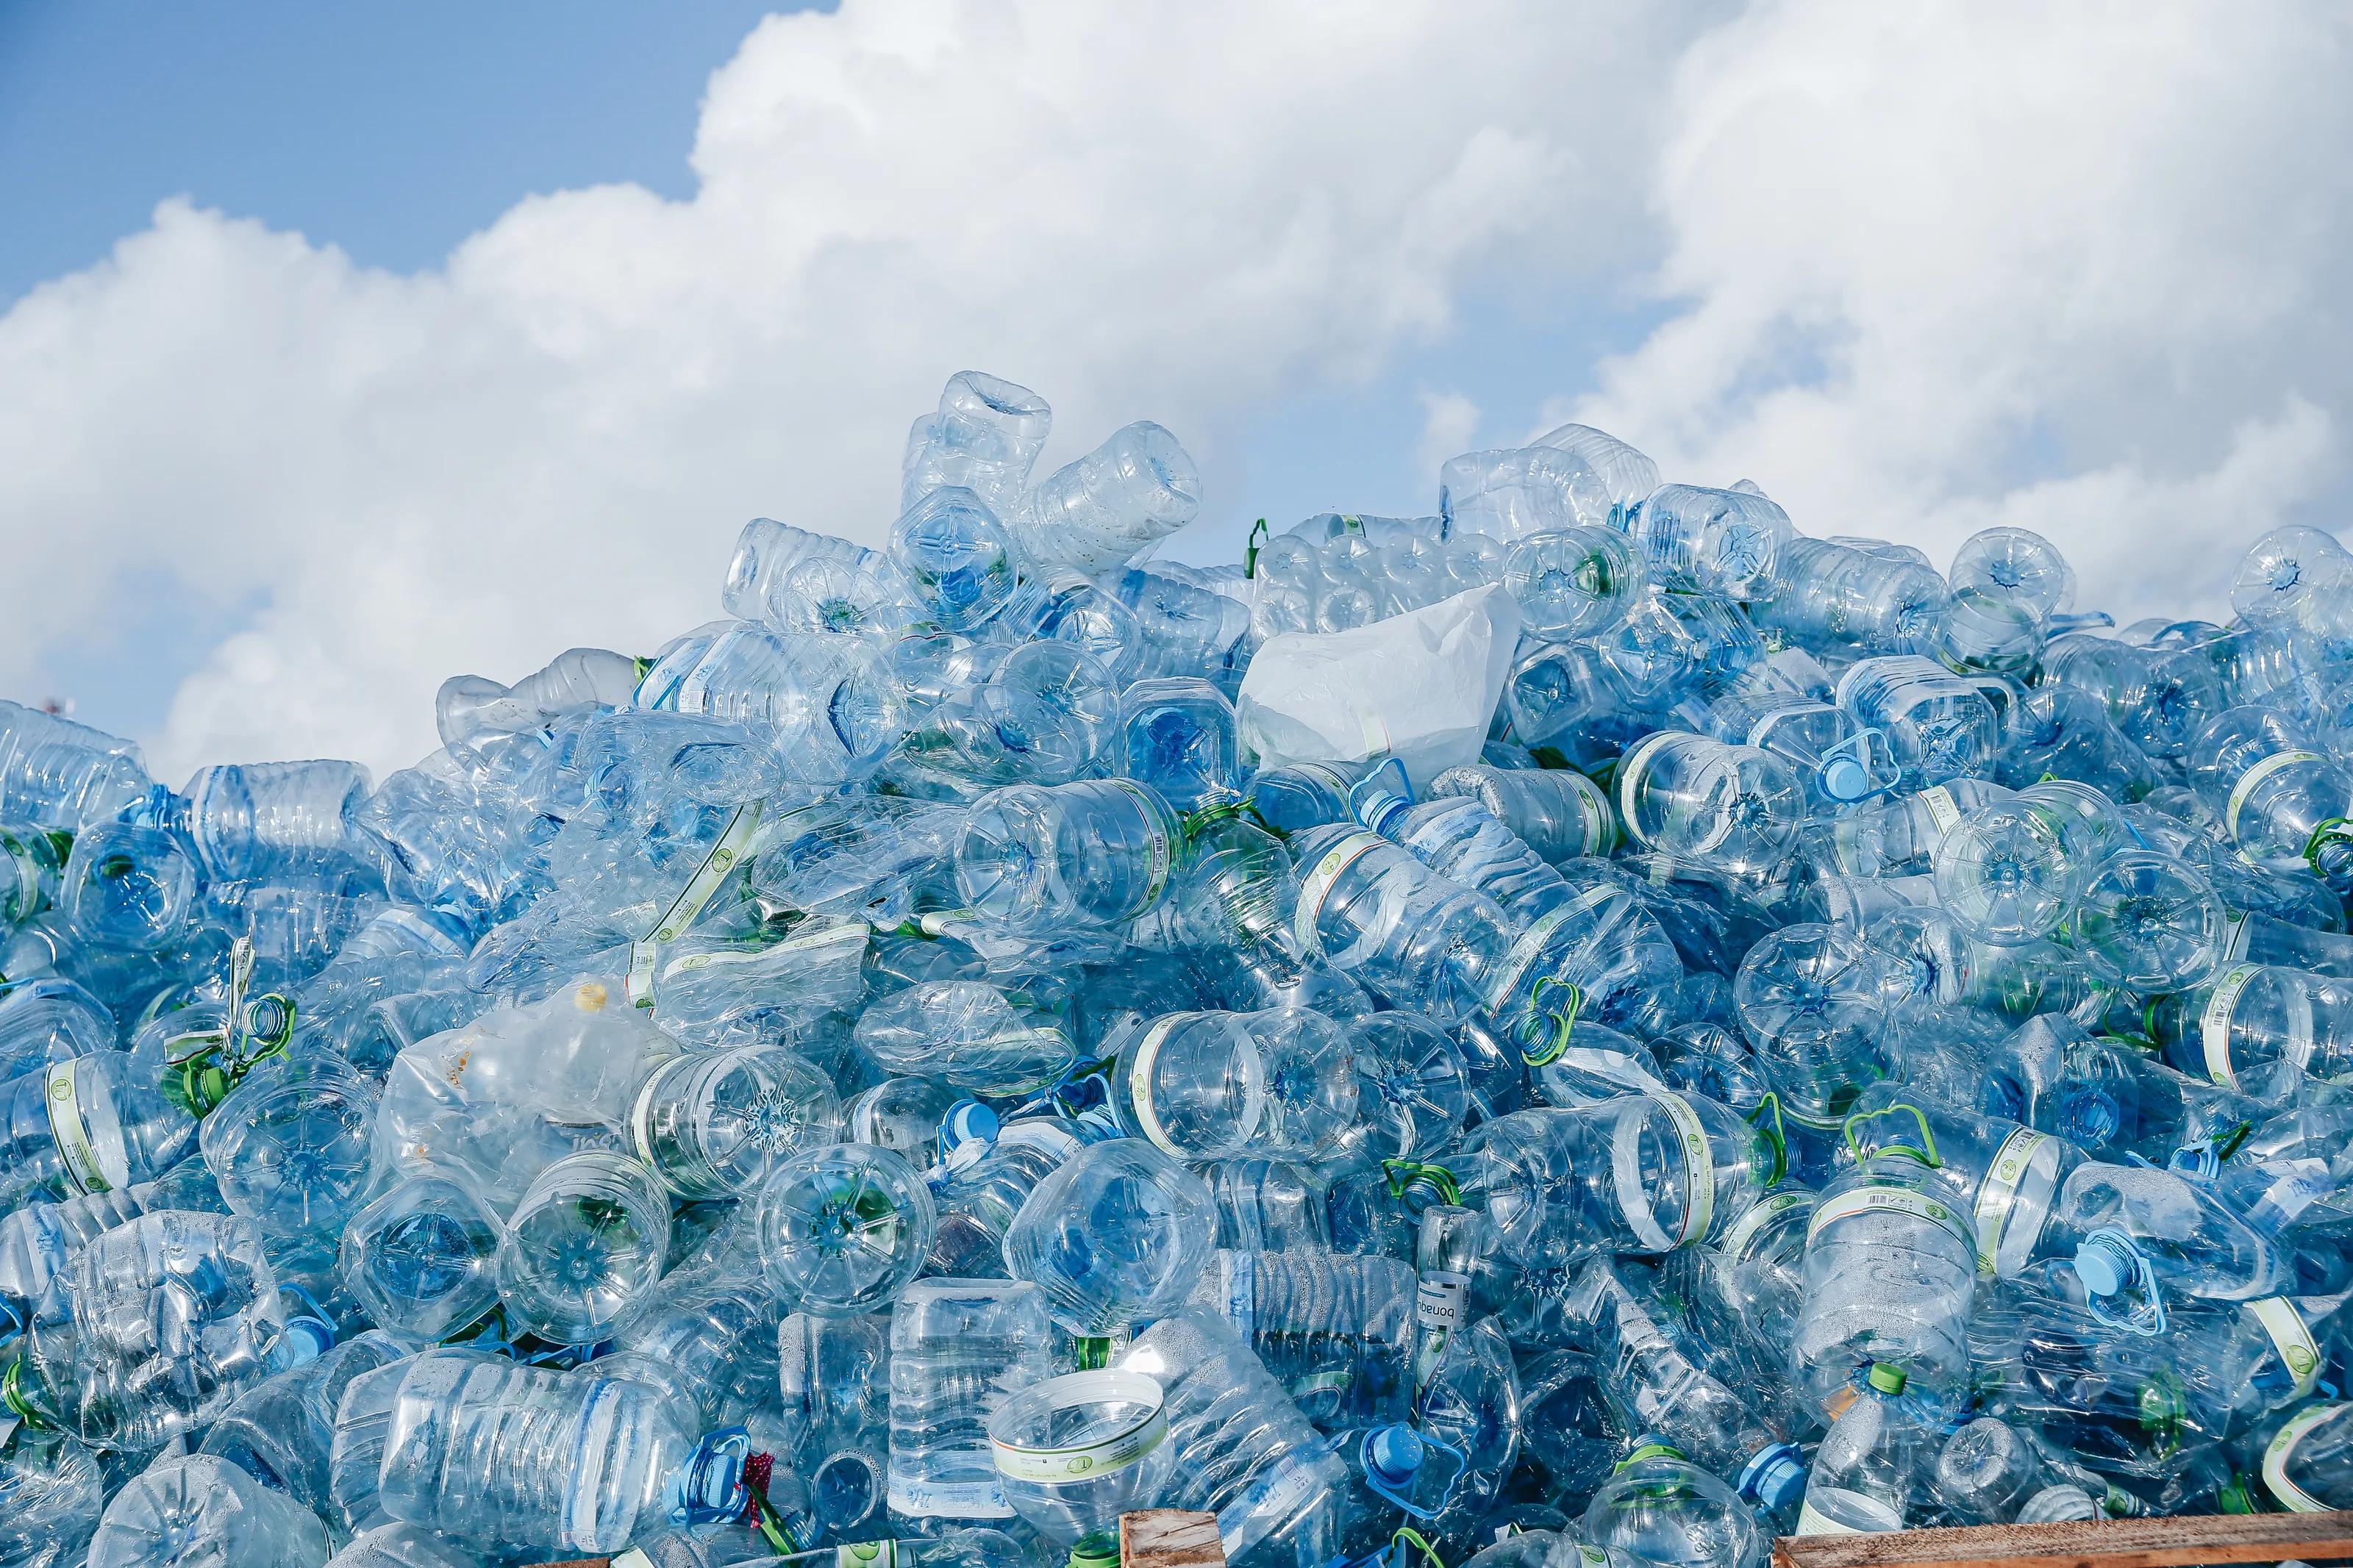
A plastic footprint is the amount of plastic an individual, business, workforce, or family uses and disposes in a specific period of time. Globally, each person produces about 27.4 kilograms of plastic waste a year from packaging, textiles and household products (EA – Earth Action, 2026).
Plastic footprint calculator
What’s yourplastic footprint?
Answer a few short questions about what you buy and use. Join free to see your yearly footprint in bottles.
What is a plastic footprint?
A plastic footprint, similar to a carbon footprint, measures the total amount of plastic waste an individual, company, or product generates. This footprint highlights an individual’s environmental impact and guides actions towards sustainability.
Average plastic footprint per person, per year
- US6,113 bottles · 122 kg
- UK3,923 bottles · 78 kg
- Philippines1,368 bottles · 27 kg
- Indonesia1,040 bottles · 21 kg
These are the country averages our calculator starts from. Your answers move your own number up or down from your country’s average.
How the calculator works.
- 1
Answer a few questions
Tell us where you live, how you get around, and how you eat and shop.
- 2
Join free to see your number
Your yearly plastic footprint in bottles, next to the average for your country. One kilogram is 50 bottles.
- 3
Cut what you can
Start with the easiest changes, like the tips further down this page.
Buying gifts this season?
Our holiday calculator shows how much plastic your gifts’ packaging and shipping add.
How much plastic does the average person use?
Two numbers answer this, and they measure different things.
| Measure | Figure | Source |
|---|---|---|
| Plastic waste per person, per yearPackaging, textiles and household productsEA – Earth Action, 2026 | 27.4 kg | EA – Earth Action, 2026 |
| Plastic used per person, per yearAll sectors, including cars, buildings and electronicsOECD, 2024 (2020 data) | about 56 kg | OECD, 2024 (2020 data) |
| Share of plastic waste mismanaged72 million of the 227 million tonnes generated each yearEA – Earth Action, 2026 | 31.6% | EA – Earth Action, 2026 |
What does mismanaged mean?
Mismanaged plastic is plastic waste that is never collected, or that ends up in open dumps, unsanitary landfill or the environment. Managed plastic is recycled, burned in an incinerator or buried in a sanitary landfill. Where collection is missing, more of every person’s plastic is mismanaged. How EA measures it
Sources: EA – Earth Action, Plastic Overshoot Day Report 2026; OECD (2024), Policy Scenarios for Eliminating Plastic Pollution by 2040.
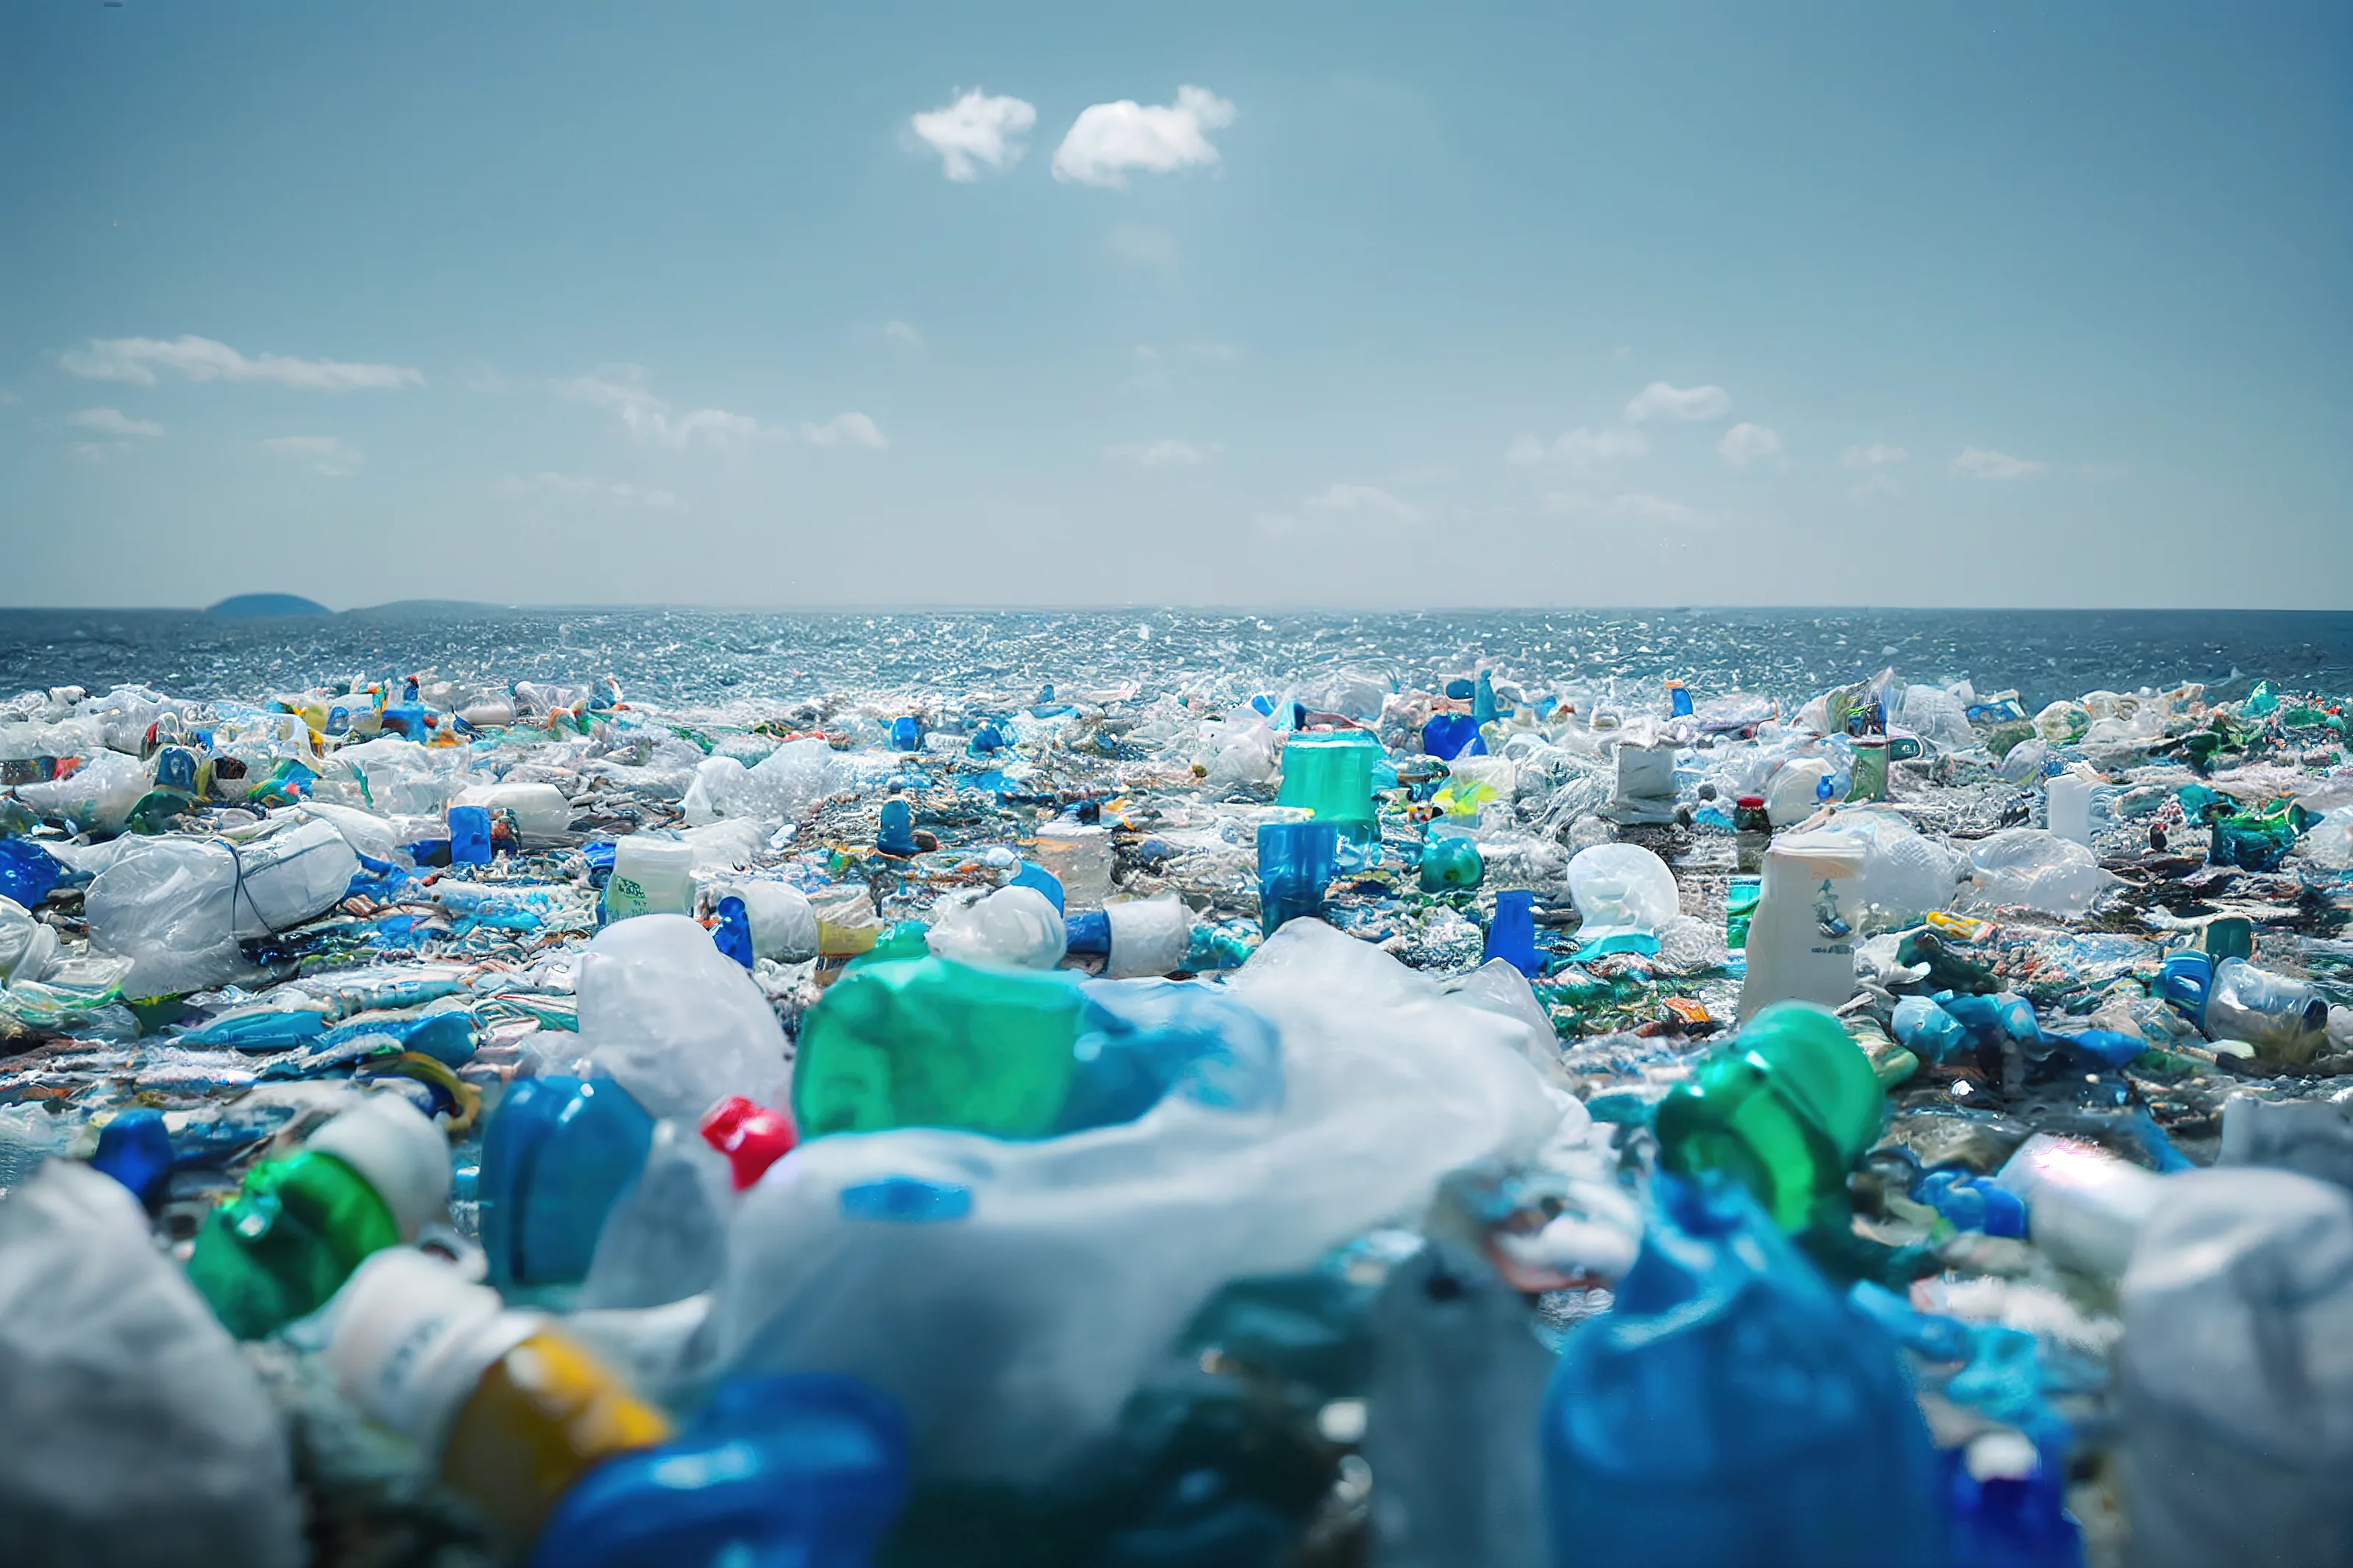
Where does plastic go?
Only 9% of the world’s plastic waste is recycled.
- Recycled9%
- Incinerated19%
- Landfill50%
- Mismanaged22%
Source: OECD (2022), Global Plastics Outlook, 2019 data.
See the global picture liveHow to reduce your plastic footprint.
- 1
Choose reusables
Avoid single-use plastic. Choose reusable containers and bottles instead.
- 2
Buy in bulk
Buy groceries in bulk to reduce plastic packaging waste.
- 3
Ask your shops
Talk to your local grocers and look for products that are helping to restore the damage that’s been done to our environment.
Plastic footprint questions
The first step is to start where you are with what you have. Here are some recommendations to get you started:
- Find out how much plastic you consume through our Plastic Footprint Calculator. Begin with small changes that can make a big impact.
- Avoid single-use plastic. Choose reusable containers and bottles instead.
- Buy groceries in bulk to reduce plastic packaging waste.
- Talk to your local grocers and look for products that are helping to restore the damage that’s been done to our environment.
Studies measure different things. Plastic waste counts what is thrown away from packaging, textiles and household products; plastic use counts everything made, including plastic in cars and buildings. The calculator’s country averages are the starting point it adjusts with your answers, so compare your result with those.
Check out the Plastic Bank blog to learn more about poverty, plastic pollution, and how humanity can overcome both. For live global figures, see the live plastic tracker.